Instrument Characteristics
Detector Specifications
Count Rates
Sky Brightness
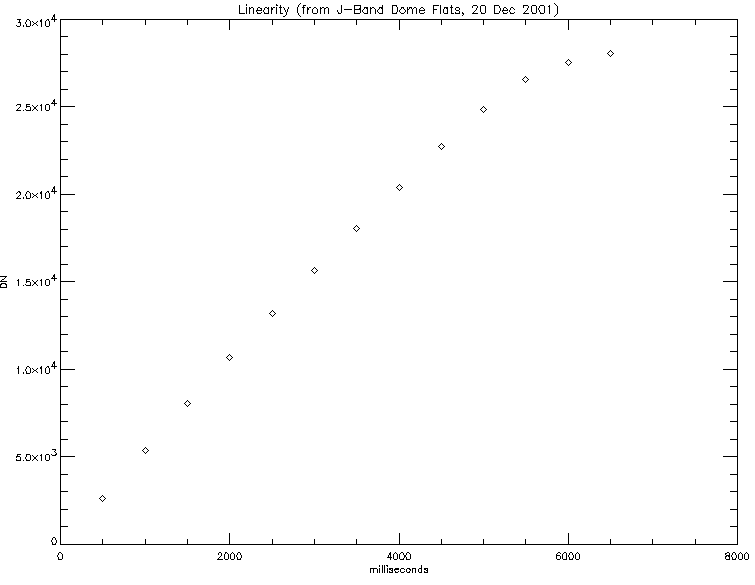
Linearity
PICNIC Focal Plane Array Technical Description
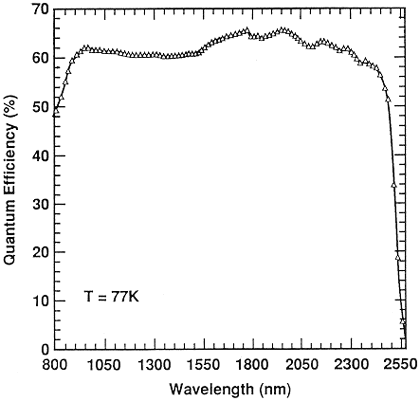
Quantum Efficiency
Throughput and Sensitivity
Detector Specifications
| Array Size: | 256x256 |
| Pixel Size: | 40x40-microns |
| Pixel Scale: | 0.0780 arcsec/pixel in RA 0.0754 arcsec/pixel in Dec |
| FOV: | ~19.5 arcsec |
| Dark Current: | ~0.2 e-/sec |
| Readnoise: | 30 e- RMS with CDS |
| Readnoise: | 12 e- RMS with 16 Reads |
| Full well: | 300,000 e- |
| K-band QE: | 62% @ 77K |
| Wavelength Range: | 0.9 - 2.5-microns |
| Gain: | ~10 e-/DN |
Approximate Count Rates
| Bandpass | Magnitude | DN/sec |
|---|---|---|
| J | 21.93 | 1 |
| H | 21.79 | 1 |
| Ks | 21.00 | 1 |
Approximate Sky Brightness
The Mt. Hamilton sky is approximately 13th magnitude per square arcsecond at K', and about one to two magnitudes fainter at J and H-bands. K and K' sky brightness, and consequently sky-limited exposures times, vary dramatically with local conditions, especially temperature.Array Linearity
PICNIC Focal Plane Array Technical Description
The following description is taken verbatim from James Graham's web description of IRCAL.The detector is an AR coated Rockwell 256 x 256 HgCdTe PICNIC array with 40 μm pixels, sensitive from 0.85 - 2.5 μm.
DATA ACQUISITION
A preamplifier is mounted externally on the dewar, connected to the detector with stainless steel coaxial cable. The detector clocking and analog to digital conversion is controlled by a set of San Diego State University (SDSU) CCD laboratory generation II readout electronics. Data are transmitted to and from the readout electronics via optical fiber. The fiber transceiver board is hosted in a VME chassis. A Force CPU-50 UltraSPARC CPU board running Solaris manages the data acquisition through shared VMEbus memory. This system is capable of acquiring data continuously at the nominal readout rate for the PICNIC array, 3 μs per pixel (57 ms for a full frame read). At this rate, the readnoise is ~ 30 electrons RMS for a single correlated double sample (CDS). We implement Fowler sampling to improve readnoise performance, and achieve ~12 electrons RMS readnoise with 16 samples. The readnoise is slightly dependent on the length of the cables between the preamp and SDSU readout electronics, and the noise environment. These readnoise figures are measured in a quiet laboratory. Performance on the telescope is slightly worse, due to noise pickup from nearby equipment.The SDSU readout electronics also incorporate a 1 μs per pixel readout mode, used with the IR Laboratories IR emission microscopes which interface to the SDSU readout electronics via a SCSI-3 interface. Since the detector has four quadrants, this readout mode exceeds the 2.5 Mpixel/s speed of the optical fiber, and we implement a two quadrant readout at this speed. However, the readnoise is typically 80 electrons RMS in this mode and it has rarely been used.
Since the PICNIC detector uses asynchronous resets on the pixel addressing shift registers, as opposed to the initialising scheme of the NICMOS detectors, it is much easier to implement subarray readouts. It is straightforward for the case that the subarrays are constrained to start at the first pixel in each quadrant. This constraint substantially simplifies the implementation of the clocking for the subarrays by making the clock wave forms for an n x m subarray different from the full 256 x 256 array only in the count of clock pulses (a corollary is that the readout for a 1024 x1024 HAWAII array is the same as a 1024 x 1024 ``subarray''). In practice, subarray readouts are preferable for achieving faster frame rates than faster readout modes, because the readnoise is preserved, and in short exposures the detector is almost always readnoise limited.
The minimum full frame, CDS integration time is 57 ms (3 μs readout) or 24 ms (1 μs readout), though only half the detector well capacity is available because the detector integrates during the first readout of the array. Although we do not provide a separate single read readout mode, it is possible to save the data without the CDS (as a data-cube of raw reads of the detector) if the second read of the CDS is saturated. Because the readnoise is substantially higher (~ 100 electrons RMS) for a single sample, it is generally preferable to use subarrays to speed up the readout when necessary. IRCAL supports subarrays from 2 x 2 up to the full frame. At present, the shortest exposure time for very small subarrays is set by a ~ 5 ms delay after the detector output amplifier is turned on. For a standard CDS readout mode (two full frame resets, two full frame reads), there are four passes through the array to complete the exposure, and it is possible to stream full frame data to disk at ~ 4 Hz (57 ms integration per frame). It is possible to increase this rate (or increase the fraction of integration time) with subarrays, fewer resets, or resetting the detector line by line instead of pixel by pixel (which substantially increases the fixed pattern bias structure because the time between reset and first read differs from pixel to pixel). We have implemented some of these modes for obtaining high frame rate data for observing occultations. In this mode it is possible to make movies for studing transient phenomena such as occultations.
Array Quantum Efficiency
Throughput and Sensitivity
The throughput of IRCAL is excellent, but due to the large number of surfaces in the AO system, and the telescope itself, the total system throughput is low, and the emissivity high, hence the high K-band background. Throughput may be higher than listed in the table if the 3-m mirror has been recently re-aluminized or if optics in the AO system have been recoated.| IRCAL Throughput and Sensitivity | ||||
|---|---|---|---|---|
| Band | Camera efficiency1 | System throughput2 | Background (mag arcsec-2) |
Point source sensitivity SNR = 5 t=300s |
| J(1.25 µm) | 0.54 | 0.08 | ... | 21.8 |
| H(1.65 µm) | 0.67 | 0.16 | 14.4 | 20.5 |
| K(2.2 µm) | 0.67 | 0.13 | 9.3 | 17.8 |
| Ks(2.1 µm) | ... | 0.14 | 10.3 | 18.3 |
|
1 Measured from the front of the dewar window to detected
photoelectrons, including filters. 2 From top of the atmosphere for a 3m clear aperature telescope, to detected photoelectrons. Measured April 2000. | ||||
Marshall Perrin created an exposure time calculator which is available at http://www.astro.ucla.edu/~mperrin/ircal/ircalexp.html. The throughput is somewhat optimistic for the current system, so exposure times are likely to be longer than indicated with the ETC.
Elinor Gates Last modified: Wed May 14 15:35:11 PDT 2008